

Picture this: it’s the end of the month and you’re doing your least favorite task once again – pulling the marketing reports. You log in to each of the dozen different sites that hold your business data and export the data reports. You spend an hour opening and copying the data from every file into one central Excel hub, when the unthinkable happens: Excel stops responding! Your last hour worth of reporting work has now been lost and you must start at square one.
We’ve heard some version of this story too many times from our clients and decided to do something about it. So, in 2020, we partnered with TapClicks to develop an omnichannel reporting platform for our clients. Our partnership allows our clients to become their own data scientist by setting and tracking goals, adding calculations, and reporting on all of their marketing campaigns in a single dashboard.
Integrated Platforms
TapClicks is integrated with over 200 data platforms that marketers use, including common sites like Google Search Console, Google Ads, LinkedIn, Instagram, and Facebook Ads. Business data is automatically pulled into the dashboard for a seamless, integrated reporting experience. TapClicks reports can even be delivered directly to your inbox at intervals of your choosing.
Since DSG is a preferred partner of TapClicks, we can work with the TapClicks team to integrate additional media platforms into the reporting portal. Working with an agency partner means we do the heavy lifting to ensure that your reports are not only formatted exactly how you like them, but yield insights that inform better marketing decisions.
Data Analysis Features
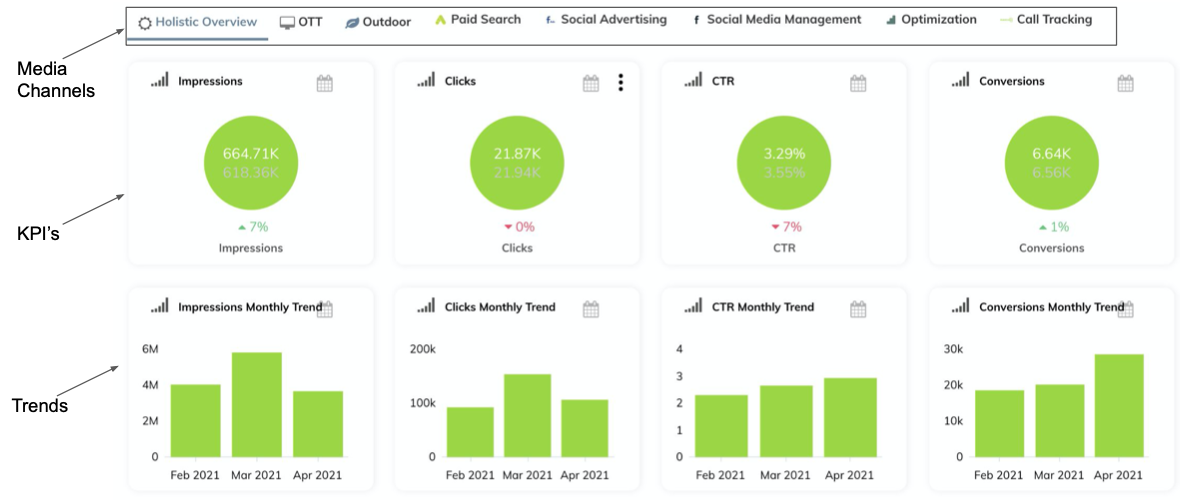
The integrated data analysis features make TapClicks your one-stop-shop for all reporting needs. Some of our clients’ most-used features include:
- Historical comparison – compare the current performance to past time frames, month over month or year over year.
- Data blending – compare key metrics across relevant channels, like clicks and impressions.
- Data segmentation – segment your data by location, by campaign, media or whatever metric you wish.
- Data aggregation – all your analytics in one, organized dashboard.
Goals and pacing – set and track custom goals.
DSG’s Steps to Implementation
DSG’s process allows for a hassle free integration of your business’ data into the TapClicks platform.
- First, DSG will evaluate your data to determine the steps that we will take for your unique business. We will also determine how your business will segment it’s data across the TapClicks dashboard.
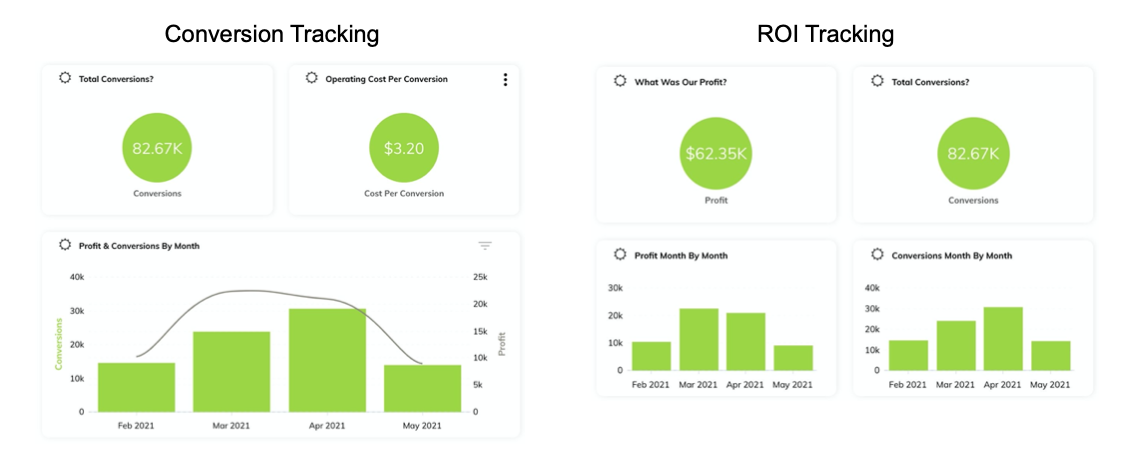
- Next, we’ll integrate matchback data to begin tracking your ROI.
- Then, we’ll arrange every detail of your custom dashboard exactly how you like it, down to the colors of the charts!
- Finally, we’ll provide training to you and your team so that you can access your new dashboard with ease, whenever you need to.
Data reporting with TapClicks is a breeze when you work alongside DSG. So, if you think it’s time to ditch your archaic Excel reporting routine, give us a shout! We’d love to give you a personalized demo and show you what we can do for your business.